

Reading the results
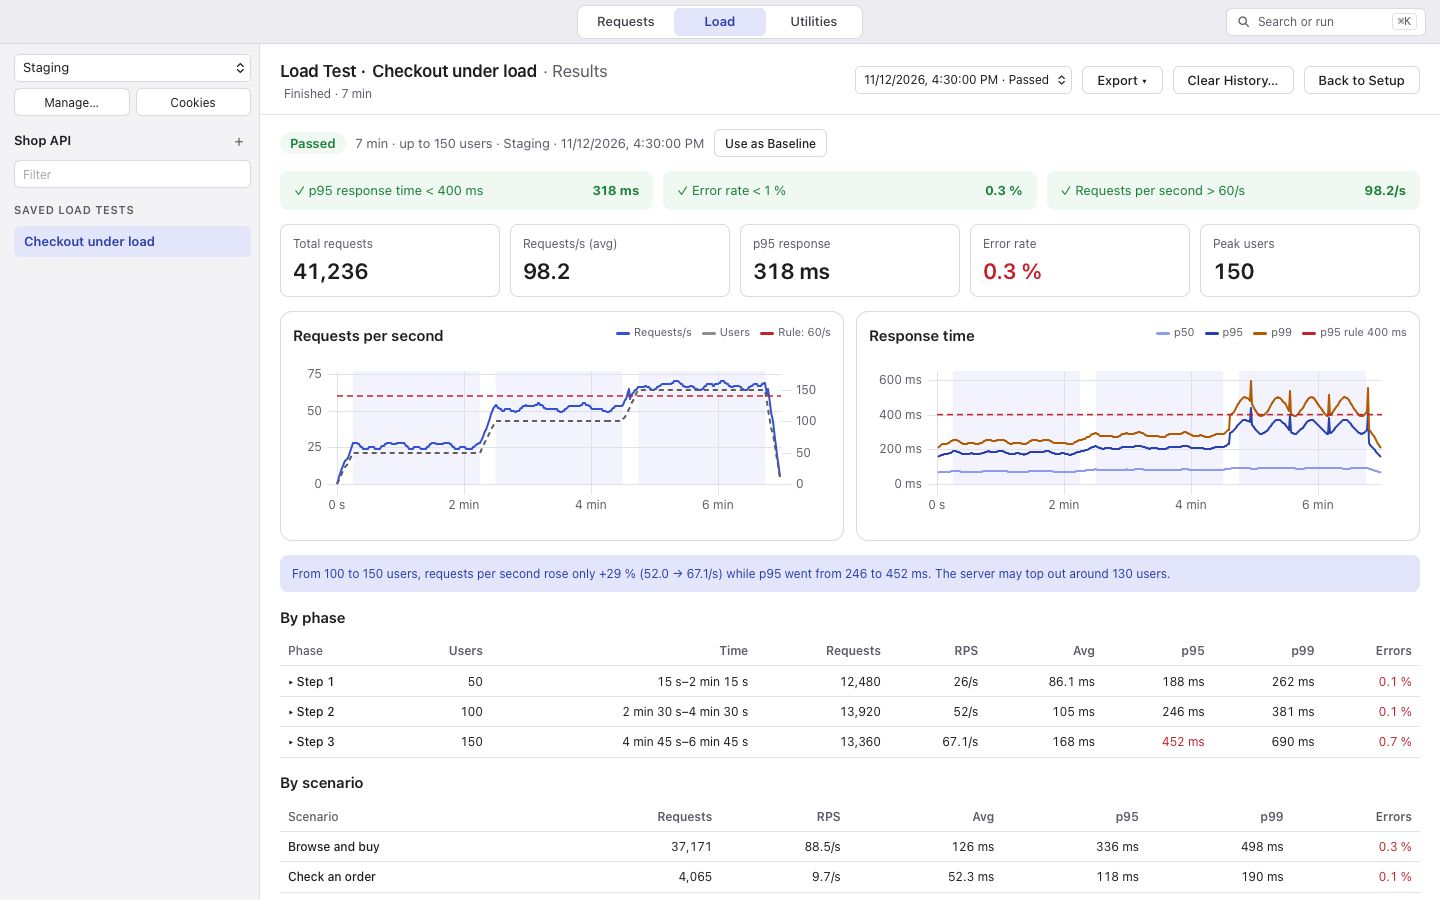
The top of the results says Passed, or Failed with the number of rules that failed, and shows each rule with the value it measured. The totals beside it show the change against your baseline; Use as Baseline makes this run the one later runs are compared with.
Charts
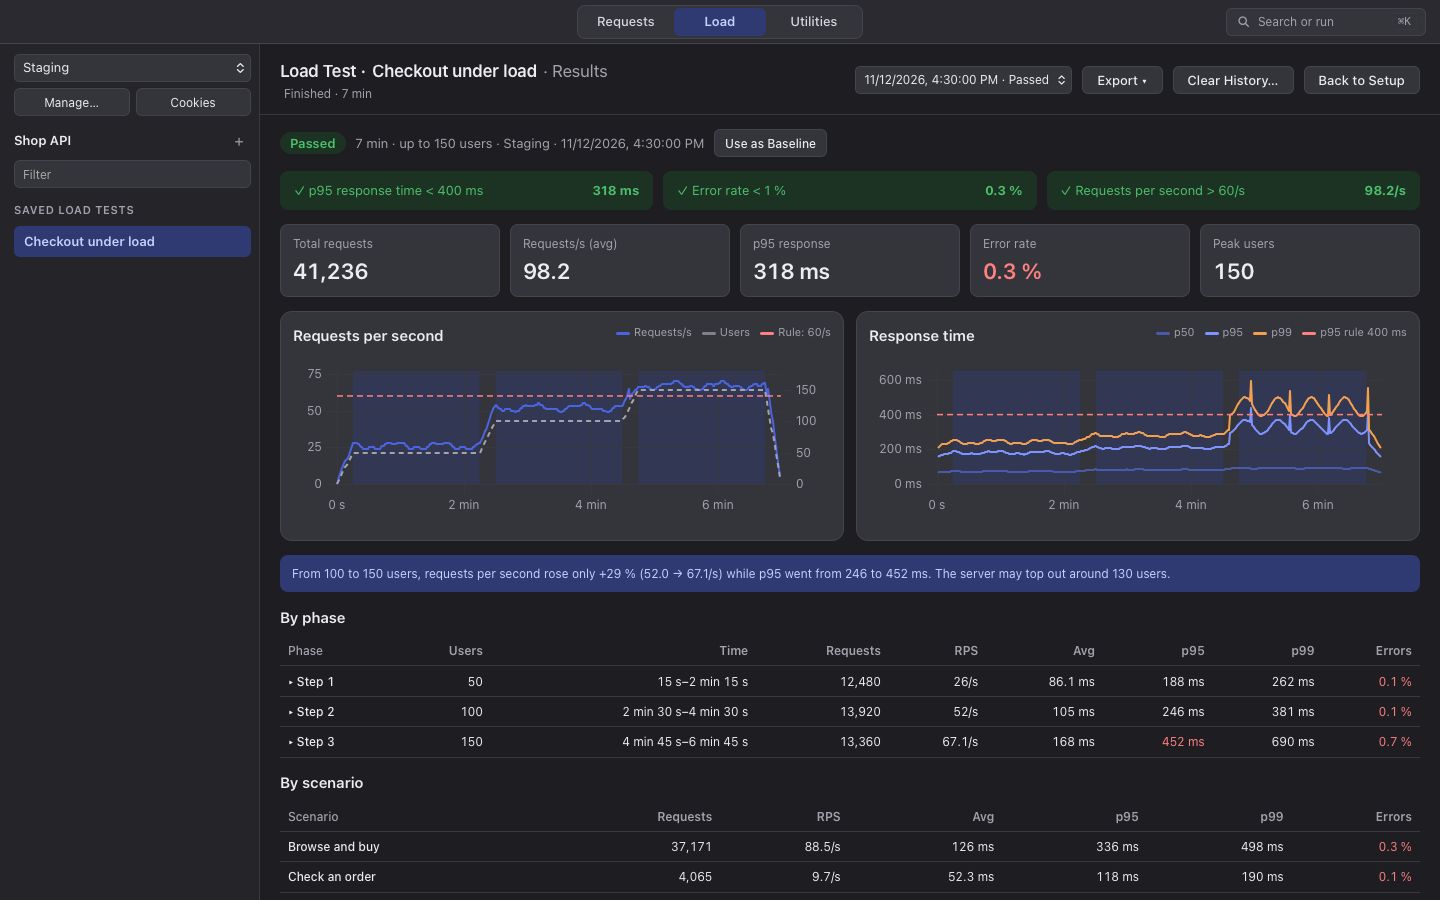
Section titled “Charts”One chart shows requests per second with the number of users; the other shows p50, p95 and p99 response times, with a line for a p95 rule. The phases where the load was held are shaded.
Below the charts
Section titled “Below the charts”- A note on capacity, when the numbers suggest the server stopped keeping up.
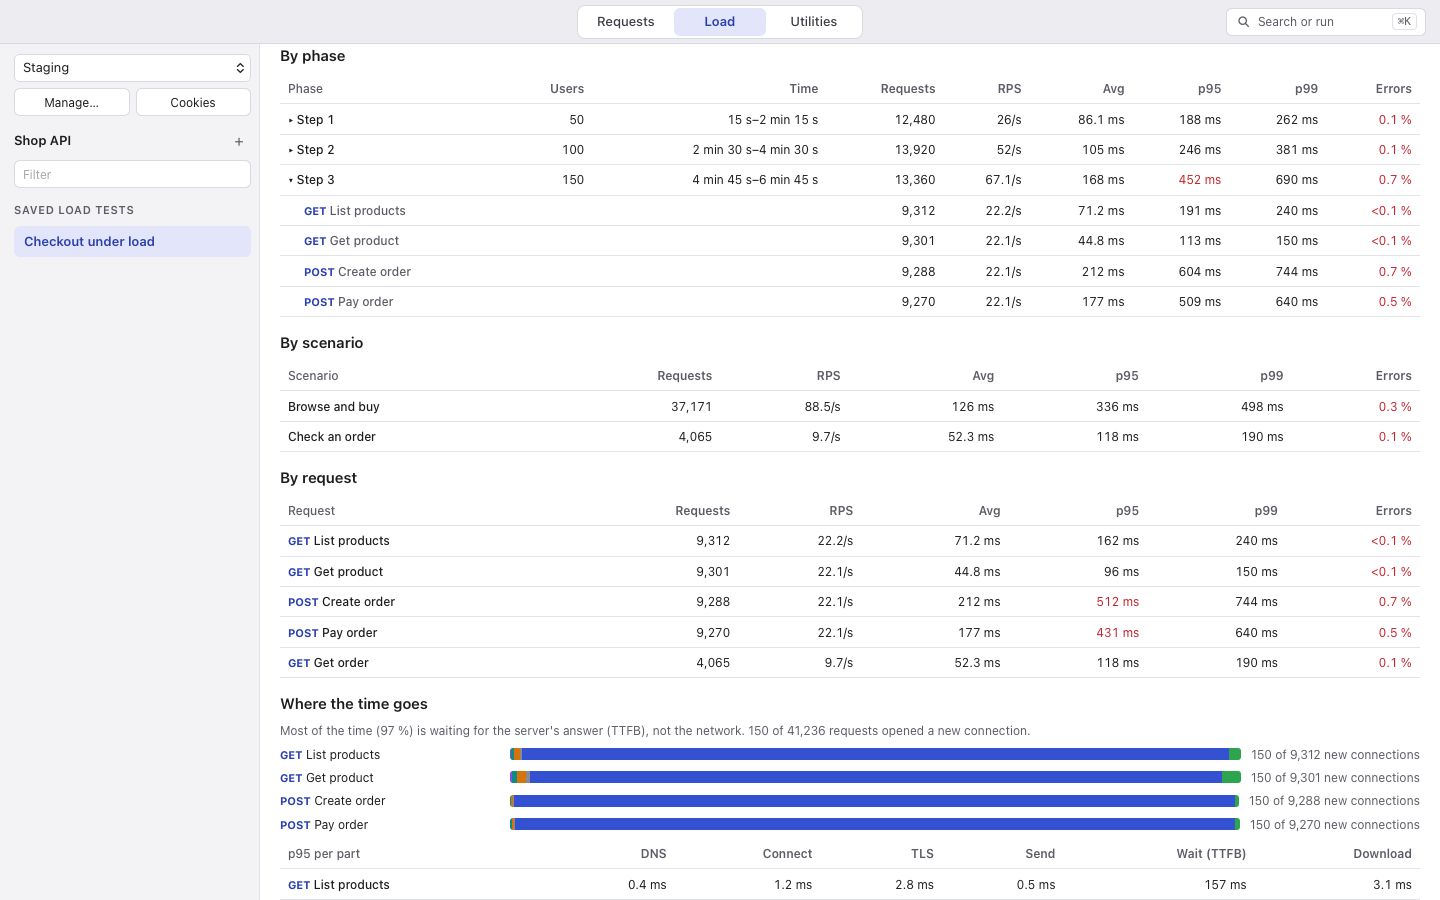
- A summary of where the time went, for example most of it waiting for the server’s answer.
- Each phase, with values over a rule in red; then each scenario and each request.
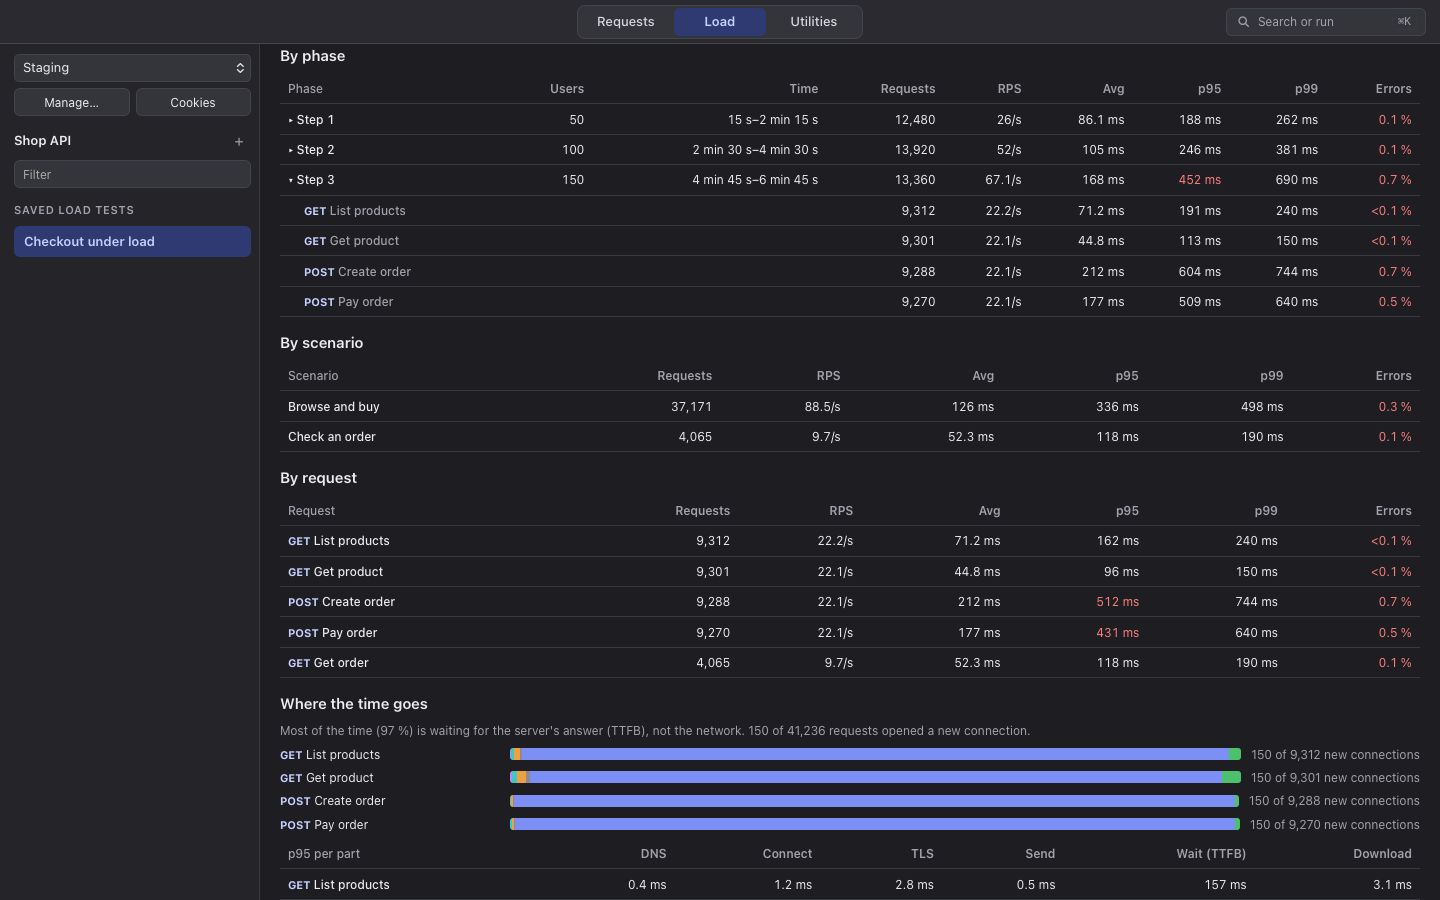
- Where the time goes: DNS, connecting, TLS, sending, waiting and downloading.
- The 20 slowest requests, with their parts.
- Status codes and errors.
korAPI keeps the last 20 runs of each collection on this computer. Pick an earlier one from the list of runs at the top.